

Hayward's Vision Zero Goal
Each year, people are needlessly killed and injured on Hayward streets. This significant loss of life is tragic, in personal loss and community impact. In addition, fear for the lack of safety on our streets results in less mobility and overall lower quality of life for all residents. In 2023, 9 people lost their lives on Hayward’s roads and many more were injured.
The City of Hayward is committed to changing that. Hayward’s City Council formally adopted Vision Zero strategies in 2023 and set a goal to eliminate all traffic fatalities and severe injuries to zero by 2050.
Fatalities & Serious Injuries Statistics
Vision Zero relies on a transparent data driven process. Collision statistics is a Safe viable to maintain transparency about efforts to eliminate traffic fatalities and severe injuries.
USER TYPE | 2026 | 2025 | 2024 | 2023 |
|---|---|---|---|---|
| Pedestrian | 4 | 1 | 3 | 1 |
| Bicycle or Scooter User | 1 | 1 | 1 | 3 |
| Driver or Passenger | 0 | 2 | 5 | 5 |
| Other | 0 | 0 | 0 | 0 |
TOTAL | 5 | 4 | 9 | 9 |
Updated: 10/1/2026 (Data will be updated quarterly)
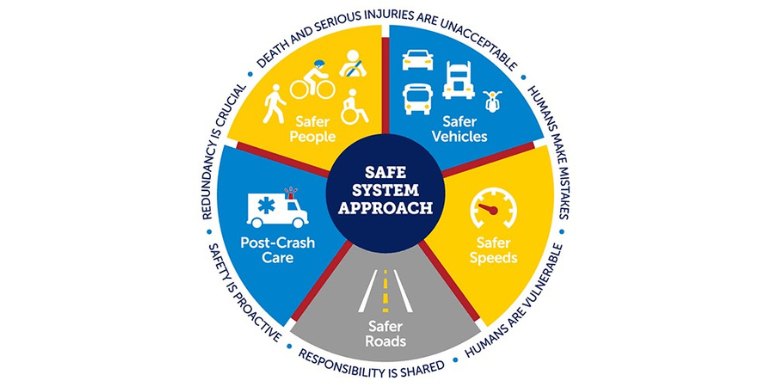
Safe Systems Approach
Zero traffic deaths starts with a safer approach to how we design and manage our roads. Supported by the U.S. Department of Transportation and the State of California, the Safe Systems Approach recognizes that people make mistakes and focuses on creating roads and streets that help prevent crashes and reduce the risk of serious injury or death.
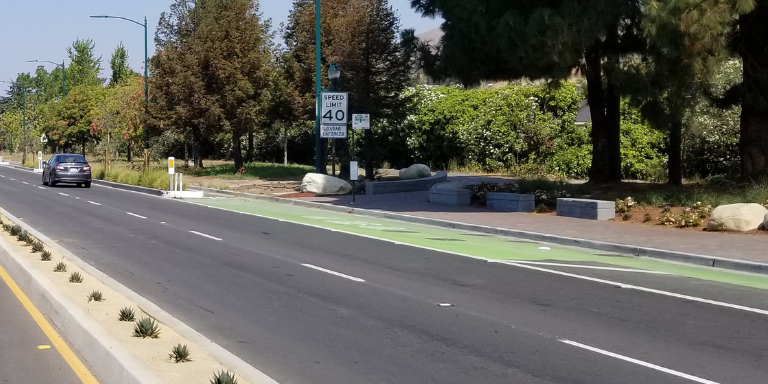
Local Road Safety Plan (LRSP)
Hayward’s Local Road Safety Plan (LRSP) is a roadmap for making our streets safer. Using local data and community demographics, the plan identifies proven strategies to improve road safety, guide future projects, prioritize investments and help the City compete for grant funding. The LRSP is a living document that will be updated at least every five years to reflect changing needs and priorities.
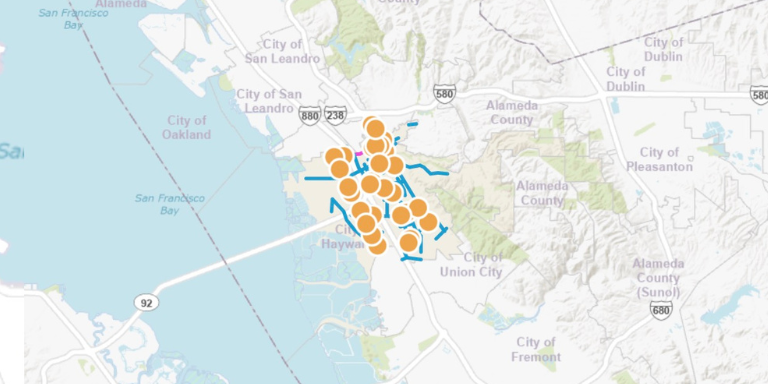
High Injury Network (HIN) GIS
The Local Road Safety Plan analyzed the City’s collisions and mapped Hayward’s intersections and roadways according to crash frequency and severity. Crashes were weighed according to severity. The result is the City’s High Injury Network (HIN). In Hayward, 75% of fatal and severe injury crashes occur on just 14% of the roadway network. The High Injury Network is a list of intersections and segments that represent the highest share of fatal and severe injury crashes.
Supporting Safety Plans
Hayward’s Vision Zero strategies are directly supported by other safety plans. These plans are an extension of and build on the framework established by the Local Road Safety Plan, focusing on specific emphasis areas and locations throughout the City.
