
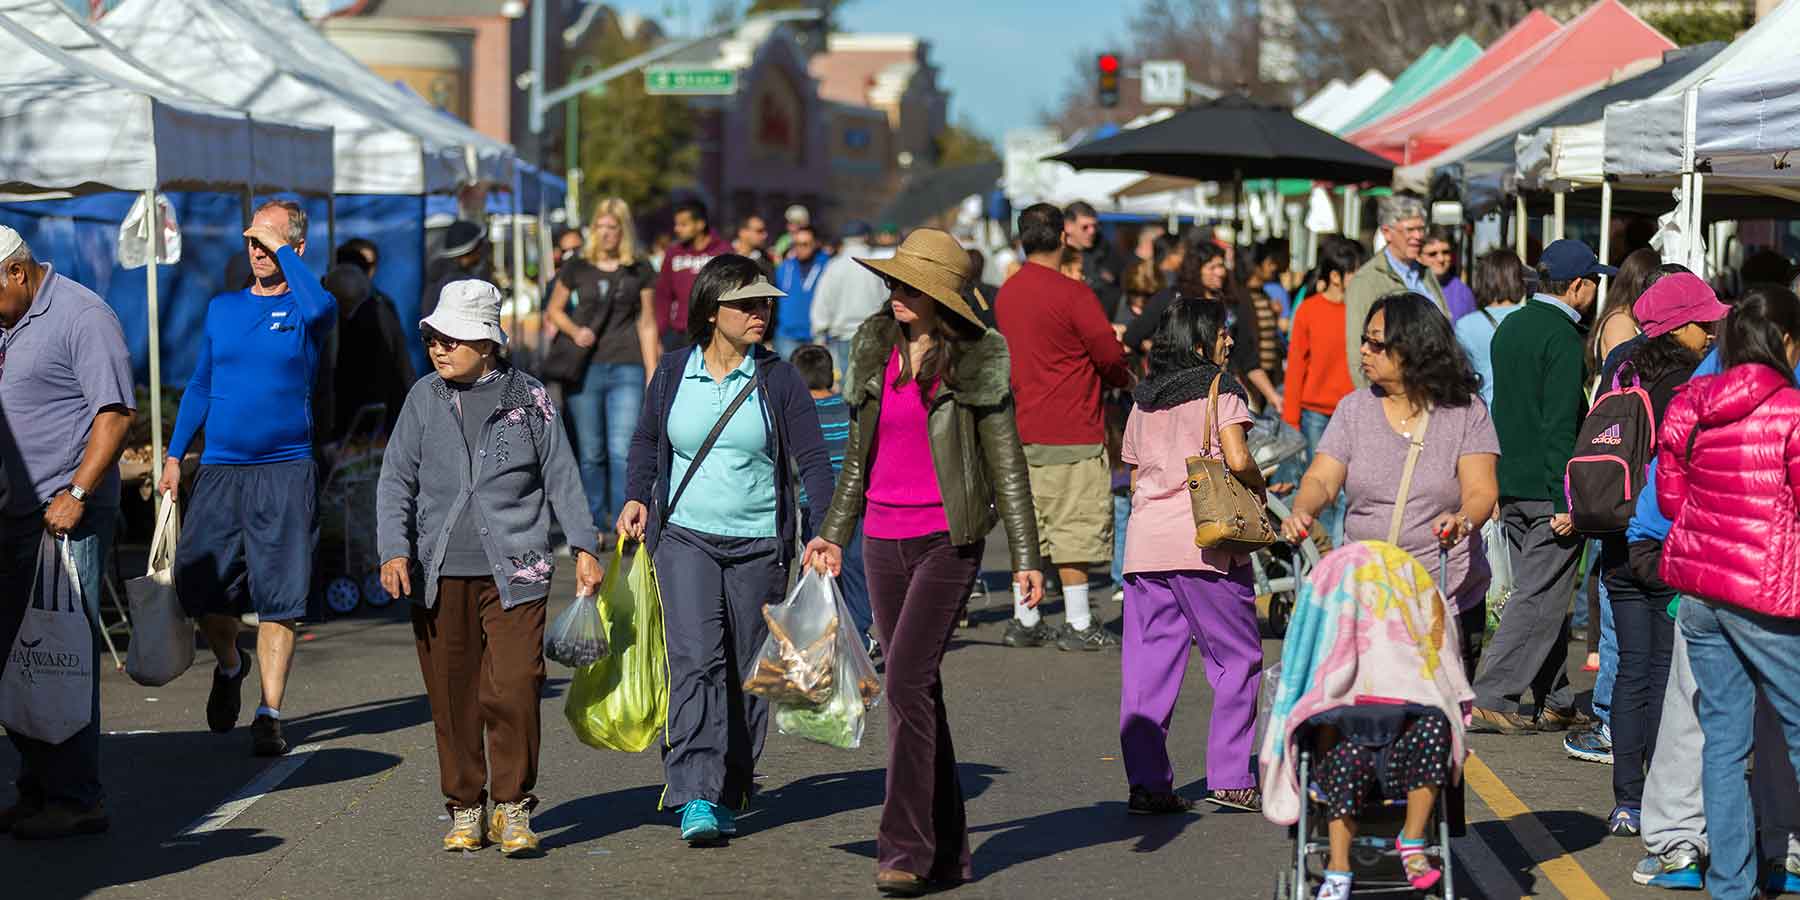


Demographics
City of Hayward Population
162,954
Source: U.S. CENSUS 2020, ACS Estimates 2021
Demographics
Diverse Community
According to the U.S. CENSUS 2020, ACS Estimates 2021
18.1% - White
8.7% - Black/African American
0.9% - American Indian and Alaska Native
2.6% - Native Hawaiian & Other Pacific Islander
4.2% - Asian Indian
6.9% - Chinese
10.7% - Filipino
0.6% - Japanese
0.7% - Korean
2.5% - Vietnamese
3.3% Other Asian
27.8% - Some other race
13.1% - Two or more races
29.9% - Mexican
0.7% - Puerto Rican
0.4% - Cuban
9.1% - Other Hispanic or Latino
*These estimated percentages do not add up to 100% because the Census records race and ethnicity in separate questions.
Demographics

79,445
Registered Hayward voters
Source: Alameda County Registrar of Voters
Demographics

OVER
80,044
Community members follow us on social media
Join the conversation. Follow us on social media.
Demographics

37.8
Years old
Median age of Hayward residents.
Source: U.S. CENSUS 2020, ACS Estimate 2021
Demographics
58.9%
of residents speak a non-English language
Source: U.S. CENSUS 2020, ACS Estimates 2021